Measuring the true CO2e emissions intensity of the grid
The way we measure the carbon intensity of our grid provides vastly different results, with different implications for where we deploy new solar and batteries, and how we manage them.
Key findings
- Battery storage is not equally valuable everywhere. South Wales averaged 248.7 gCO2e per kWh in 2025 and South Scotland 19.6, and the swing available within a typical day ran from 35 g in North East England to 245 g in South West England. The same battery, doing the same thing, has seven times more to work with in one place than in the other. Support for storage currently treats a megawatt-hour as a megawatt-hour wherever it sits. If the aim is to reduce emissions rather than to build capacity, policy should follow the sites where the grid moves most.
- An annual emissions factor is likely to overstate a site's emissions if it has a battery and understate them if it has solar. On this worked example the annual figure is 28 tonnes above the measured one for the battery, and 17 tonnes below it for solar. In the Lupa platform we calculate both the annual statutory figure and the half-hourly measured one, so the number a client is required to publish sits beside a number that much more accurately reflects its true impact.
- To truly optimise BTM batteries, we need much better price signals from our electricity tariffs. Wholesale price and CO2e intensity correlate at 0.67 across 2025, which is close enough that a cost-optimising battery naturally discharges during clean hours. That signal reaches a site only through a contract with a pass-through commodity element with granular pricing bands. On a flat rate, even where time-of-use bands are in place, there is little to reward a business for moving consumption into clean hours. Most British businesses are on contracts of that kind.
How UK grid carbon intensity varies by time of day
Across 2025 the half-hourly carbon intensity of the GB grid, measured as CO2e, ranged from 24 g per kWh to 293 g per kWh, a factor of twelve. Averaged by time of day, the pattern is regular enough to plan against.
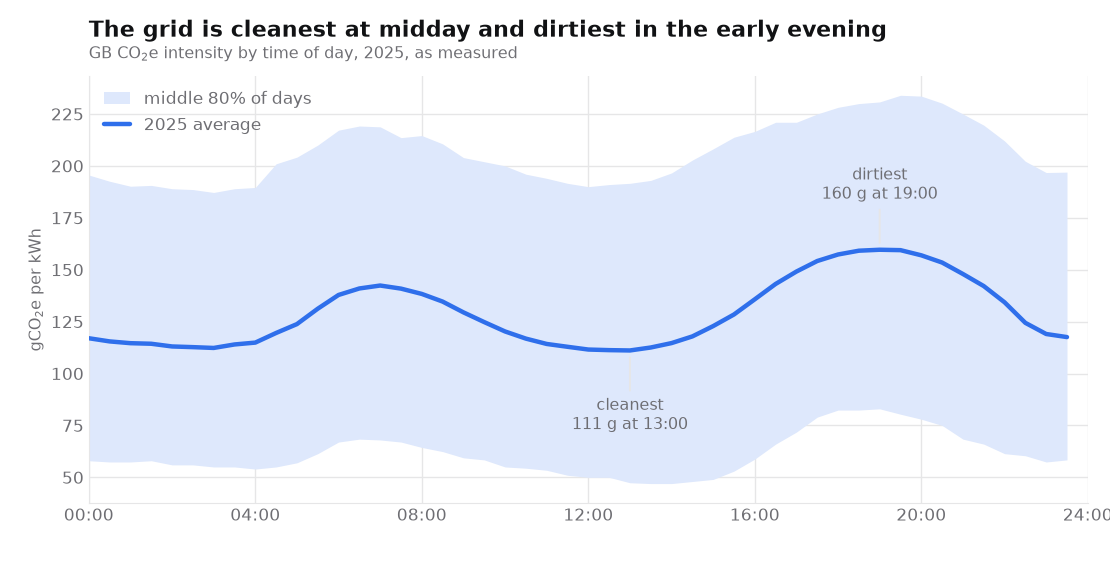
The cleanest half hour of the average day is 13:00 at 111 g and the dirtiest is 19:00 at 160 g. The variation is seasonal and weekly as well as daily. January averaged 168 g and June 99 g. Weekdays averaged 136 g against 113 g at weekends, with Wednesday the dirtiest day at 144 g and Sunday the cleanest at 111 g. The dirtiest conditions of all are winter weekday evenings: between 17:00 and 20:00 from November to February the grid averaged 172 g, against 80 g for summer middays. Solar has created a midday trough that is now cleaner than the small hours of the night, and the evening peak forms as solar falls away and gas takes its place.
A worked example on a distribution warehouse
The building is a large cross-dock distribution unit of 40,000 square metres, using 1,500 MWh a year, peaking at 795 kW and operating six days a week from 06:00 to 22:00. It sits on a real supply contract, made up of several separate charges rather than a single unit price.
The largest component is the wholesale cost, which tracks the market price of electricity and changes every half hour. In 2025 it averaged 7.98p per kWh. On 488 half-hour periods, roughly 3% of the year, it fell below zero, with renewable generation high enough that suppliers were effectively paid to take power off the system.
Network charges, covering use of the wires, are time-banded into red, amber and green periods. Red applies on weekday late afternoons when the grid is busiest and is the most expensive band; green covers nights and weekends and is cheap. A capacity charge is billed separately on the maximum load agreed with the network operator, whether or not it is used.
The remainder is made up of the standard government levies: the Renewables Obligation, Contracts for Difference, feed-in tariff levelisation and the Climate Change Levy. These are fixed per kWh and apply to all users.
We then compared four scenarios over the same year:
- Scenario 1: the site as it stands, importing everything from the grid
- Scenario 2: a 2 MWh battery on its own
- Scenario 3: 750 kWp of rooftop solar on its own
- Scenario 4: the solar and the battery together
The battery is dispatched to minimise cost against the contract above. Its objective contains no CO2e information at all.
We calculated the CO2e emissions of each option two ways: once with a single annual factor applied to total imported energy, and once against the measured national intensity of the grid, half hour by half hour. The annual factor is the standard method. Statutory reporting in the United Kingdom under SECR requires the government's published annual conversion factor, and the location-based method in the GHG Protocol relies on the same annualised emissions factors.
Why annual and half-hourly emissions figures disagree
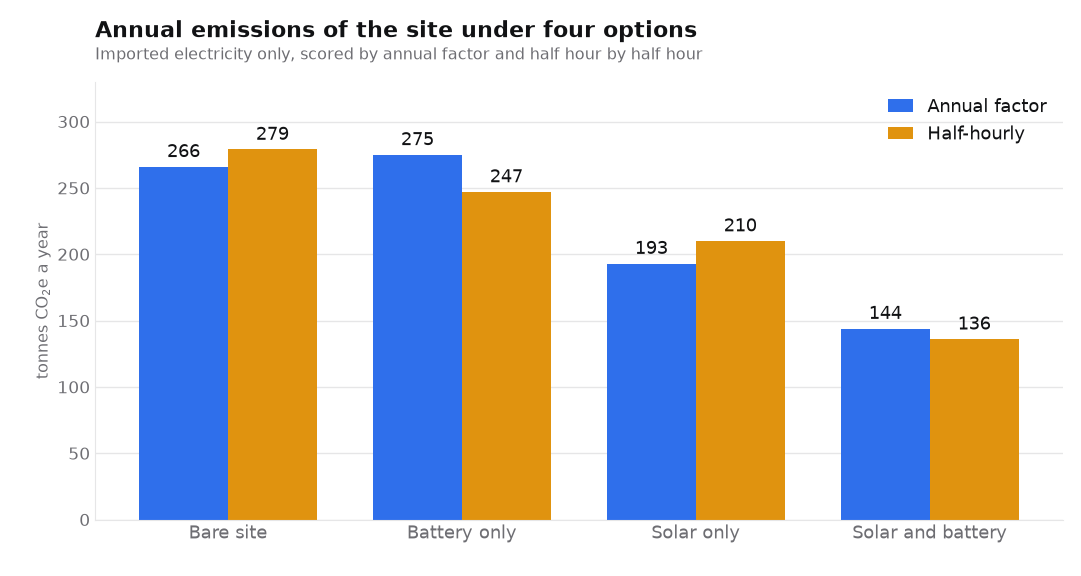
The site as it stands imports 266 tonnes CO2e based on the annual factor and 279 tonnes scored half hour by half hour, a gap of 13 tonnes before any equipment is installed. The principal reason for this is that the building runs from 06:00 to 22:00, so a significant portion of the site's consumption sits in the morning and evening periods when the grid is dirtier than the yearly average.
Adding the battery on its own raises the figure to 275 tonnes on the annual basis and lowers it to 247 tonnes on the half-hourly basis. That represents either a rise of 9.6 tonnes or a fall of 32.1 tonnes, depending on which method you use. Round-trip losses mean a battery always raises total import in absolute terms, about 54 MWh over this year. When scored half hour by half hour on the other hand, the battery charges in periods averaging 95.9 gCO2e per kWh and discharges into periods averaging 154.7, cutting the site's emissions by around 11%.
Looking at solar on its own, imports fall by 412 MWh, and emissions by 72.9 tonnes on the annual basis and 68.8 tonnes on the half-hourly basis. The annual figure suggests a six per cent higher emissions reduction because solar generates at midday, and midday is when the grid is already at its cleanest.
Solar and batteries bring imports down by 687 MWh, saving 121.5 tonnes on the annual basis and 142.7 tonnes on the half-hourly basis. Here the annualised method understates the extent of the emissions savings because the battery moves solar generation into the evening periods when the grid is at its dirtiest.
The error in an annual factor is therefore not a constant that cancels out across a portfolio. Both its size and its direction depend on the site's consumption profile and the behaviour of the battery.
Does wholesale price track carbon intensity?
Lupa's optimiser is given no CO2e information at all. Its objective is driven by cost alone, and it lands on clean hours only because price and CO2e intensity are closely correlated: when the wind is blowing and demand is low, prices fall.
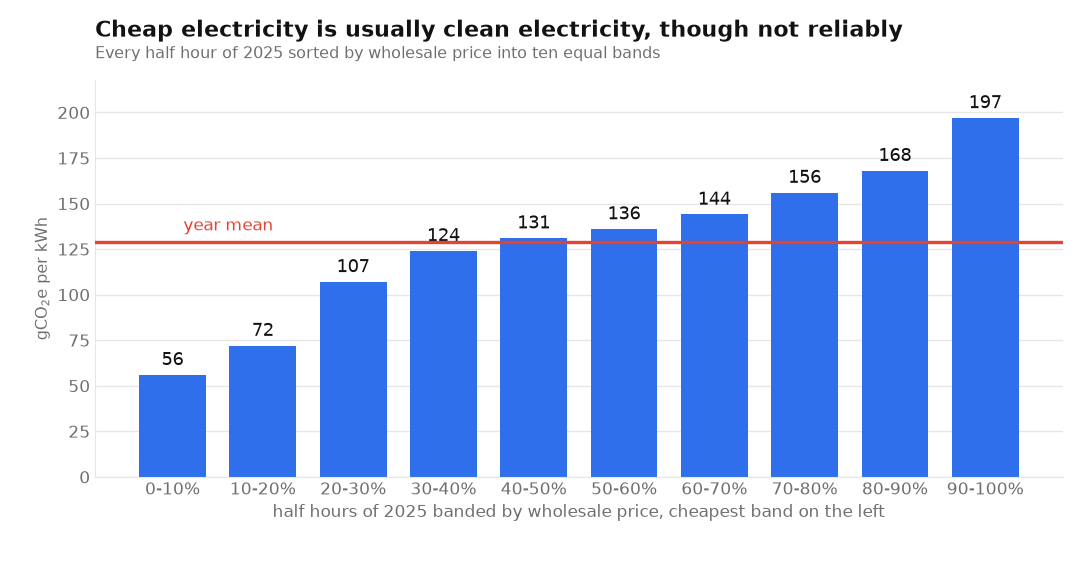
Sorting every half hour of 2025 by wholesale price into ten equal bands produces a steady rise, from 57 g per kWh in the cheapest tenth to 196 g in the most expensive, against a year mean of 129 g. Half hours priced below zero averaged 51 g. The relationship is strong at a rank correlation of 0.67, so price serves as a good, if not perfect, proxy for CO2e. It is much stronger at the extremities. Within the lowest and highest fifths of the year the rank correlation is 0.84, while across the middle sixty per cent it falls to 0.28. This is significant as the battery charges and discharges at the two ends of the price distribution, where the proxy is at its strongest.
| Wholesale price band | Mean carbon intensity gCO2e per kWh |
|---|---|
| Cheapest 10% | 57 |
| 10-20% | 75 |
| 20-30% | 110 |
| 30-40% | 125 |
| 40-50% | 131 |
| 50-60% | 134 |
| 60-70% | 142 |
| 70-80% | 154 |
| 80-90% | 166 |
| Dearest 10% | 196 |
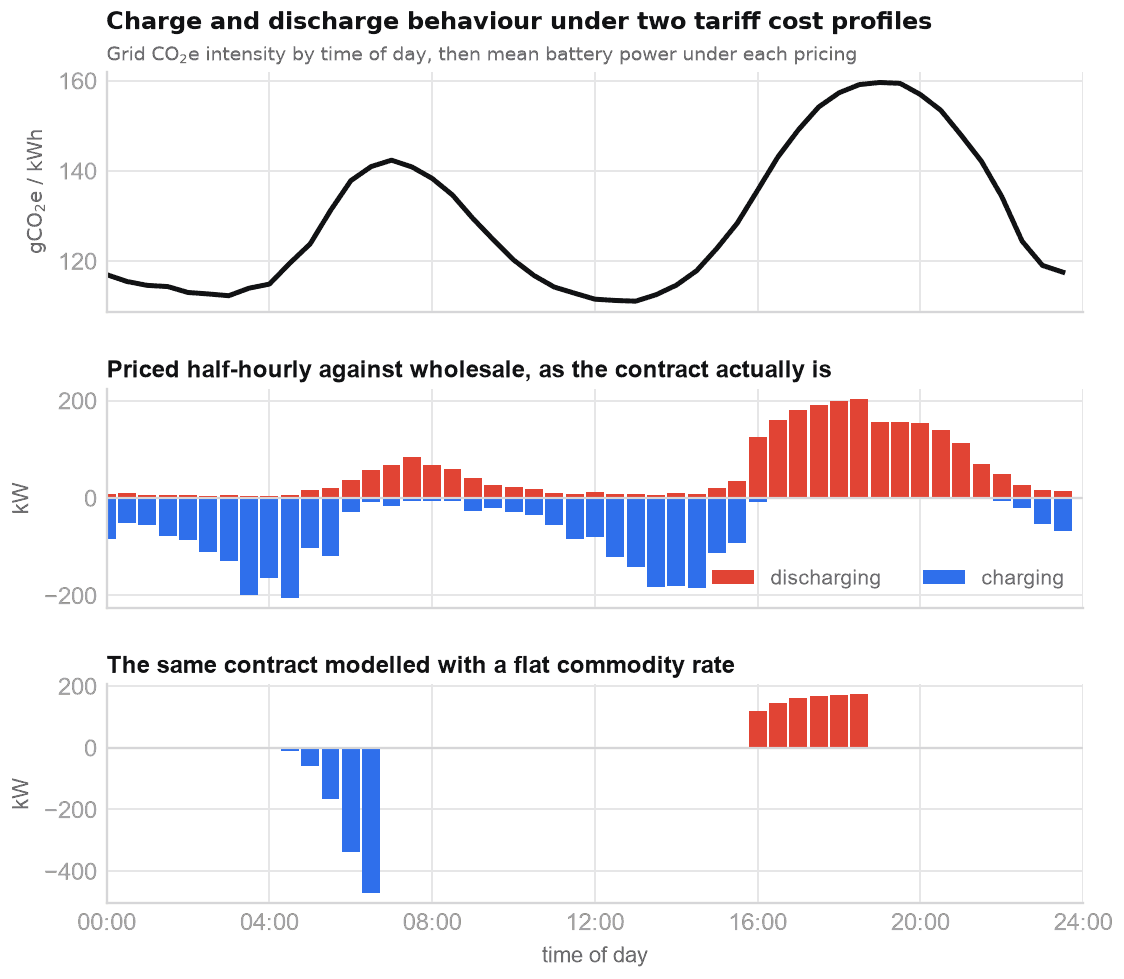
The middle panel is the contract as currently priced. The battery charges overnight, and again in the middle of the day, which are the two cleanest windows on the grid, while discharging into the evening peak.
What happens to a battery on a flat tariff
The bottom panel is the same contract, the same building and the same year, modelled with a flat commodity rate instead of the half-hourly price. This is a common shortcut. The tariff still varies by time of day, because the red, amber and green distribution bands remain in place. However, without the strongest price signal, the emissions-saving potential of the battery is severely limited. There is simply no clear financial driver to charge during the dirty periods and discharge during the clean ones. The battery cycles 95 times instead of 270, leaves the midday trough alone entirely, and its measured CO2e effect falls from 32.1 tonnes better to 0.4 tonnes worse than the annualised emissions factor.
Carbon intensity by UK region
Everything above uses the national series, which is a significant oversimplification as the emissions intensity of the grid varies dramatically across geography.
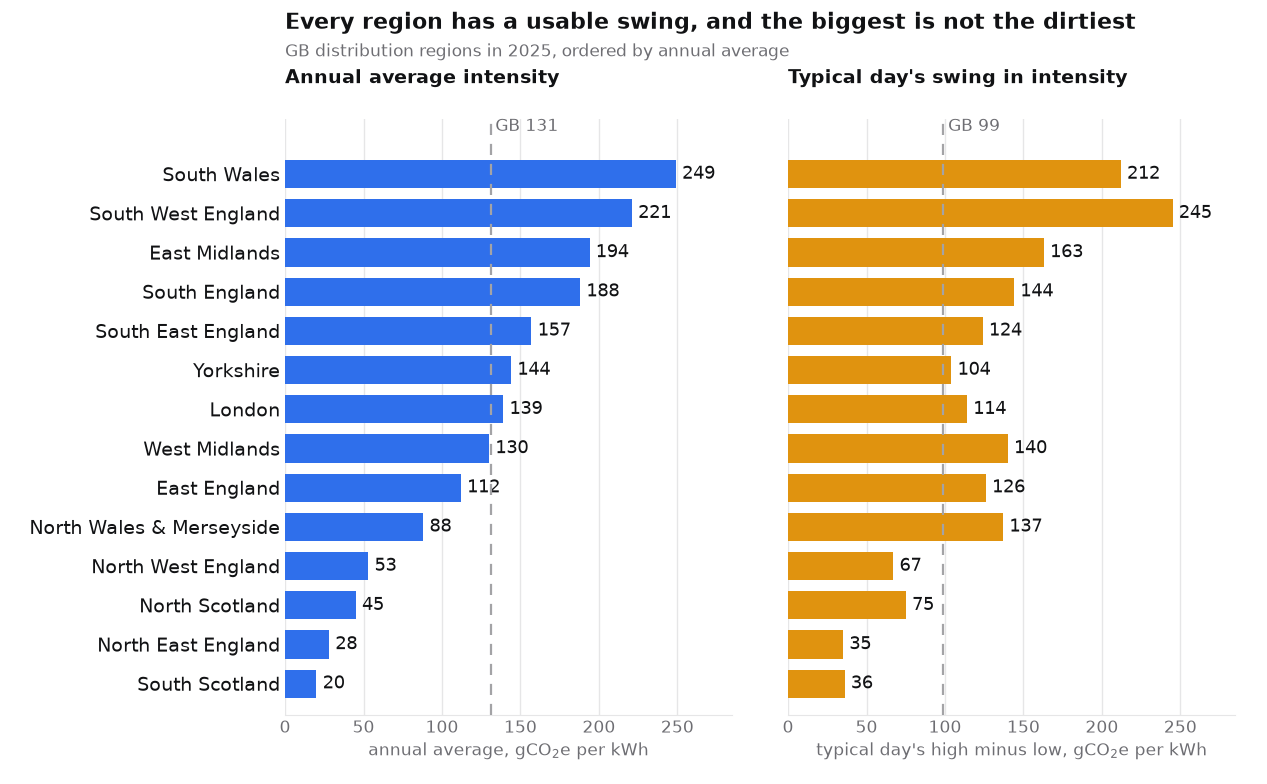
In 2025, South Scotland averaged 19.6 gCO2e per kWh and South Wales averaged 248.7, against a national figure of 130.5 g. That is a factor of twelve between two parts of the same country in the same year. A building in Ayrshire and a building outside Cardiff, drawing identical power at identical times, will have wildly different emissions.
The right-hand chart plots the swing in CO2e intensity within a day, so the figure shown is the average of each day's own highest and lowest half hour. South West England has the largest daily swing of any region at 245 g, larger than South Wales, despite having a slightly cleaner grid. The reason is a combination of heavy solar and heavy gas. Across 2025, solar supplied 56% of the electricity consumed in the region between 11:00 and 15:00, which deepens the midday trough, while gas supplied 62% between 17:00 and 20:00 as the solar fell away. South Wales, with the dirtier grid overall, takes 23% from solar at midday and 75% from gas in the evening, so its day starts and ends closer together. The best region for a CO2e-motivated battery is therefore not simply the dirtiest one.
| GB distribution region | Annual average gCO2e per kWh | Typical daily swing gCO2e per kWh |
|---|---|---|
| South Wales | 248.7 | 212 |
| South West England | 221 | 245 |
| East Midlands | 194 | 163 |
| South England | 188 | 144 |
| South East England | 157 | 124 |
| Yorkshire | 144 | 104 |
| London | 139 | 114 |
| West Midlands | 130 | 140 |
| East England | 112 | 126 |
| North Wales & Merseyside | 88 | 137 |
| North West England | 53 | 67 |
| North Scotland | 45 | 75 |
| North East England | 28 | 35 |
| South Scotland | 19.6 | 36 |
Where reporting and pricing are heading
The way emissions are counted is already being revised. The GHG Protocol opened a public consultation on its Scope 2 Guidance in October 2025 proposing an hourly matching and deliverability requirement for market-based reporting, and an option to report location-based inventories on an hourly basis. The revised standard is expected in 2027, phased in over several years after that so by 2030 it is very likely that hourly reporting will be standard practice.
Electricity pricing is moving in the same direction. Market-wide Half-Hourly Settlement began migrating meters in October 2025 and completes in 2027. However, nothing obliges either a supplier to provide a TOU tariff or customer to choose one. Exposure to a half-hourly price therefore looks set to remain a commercial decision, which is what makes tools such as Lupa so vital.
It is also worth noting that a site where the existing contract lacks a half-hourly signal can get one from outside that contract. P415, implemented in November 2024, created the Virtual Trading Party, which lets an aggregator trade a site's flexibility in the wholesale market without going through the site's supplier. We have written separately about P415 and its equivalents across Europe, and about how far day-ahead prices actually move within a day in ten European markets.
A battery is not always chasing a price. Where a site is electrifying its heating or its vehicles, the same equipment can be holding a grid connection open instead, which is the subject of how battery storage can facilitate heating electrification and commercial fleet charging.
Common questions
What is the carbon intensity of the UK grid?
In 2025 the GB grid averaged 129 gCO2e per kWh as measured, but the half-hourly figure ranged from 24 g to 293 g, a factor of twelve. The cleanest half hour of the average day is 13:00 at 111 g and the dirtiest is 19:00 at 160 g. Statutory reporting under SECR uses a single annual factor of 177 gCO2e per kWh, which is higher because it is built from actuals that lag by about two years.
Does a battery reduce carbon emissions?
It depends entirely on how you count and how the tariff is priced. On the worked example here, a 2 MWh battery raises the site's emissions by 9.6 tonnes on an annual factor and lowers them by 32.1 tonnes measured half hour by half hour. A battery always increases total imported energy through round-trip losses, so an annual factor can only ever show it as worse. What it changes is when energy is drawn, which only a half-hourly measurement can see.
Why do annual and half-hourly emissions figures differ?
An annual factor multiplies total imported energy by one constant, so it carries no information about when that energy was drawn. A half-hourly measurement prices each interval against the grid as it actually was. The gap is not a fixed offset: on this site the annual figure overstates solar's saving by six per cent but that will differ for every site.
Try Lupa free for sixty days and run your own building against the measured grid